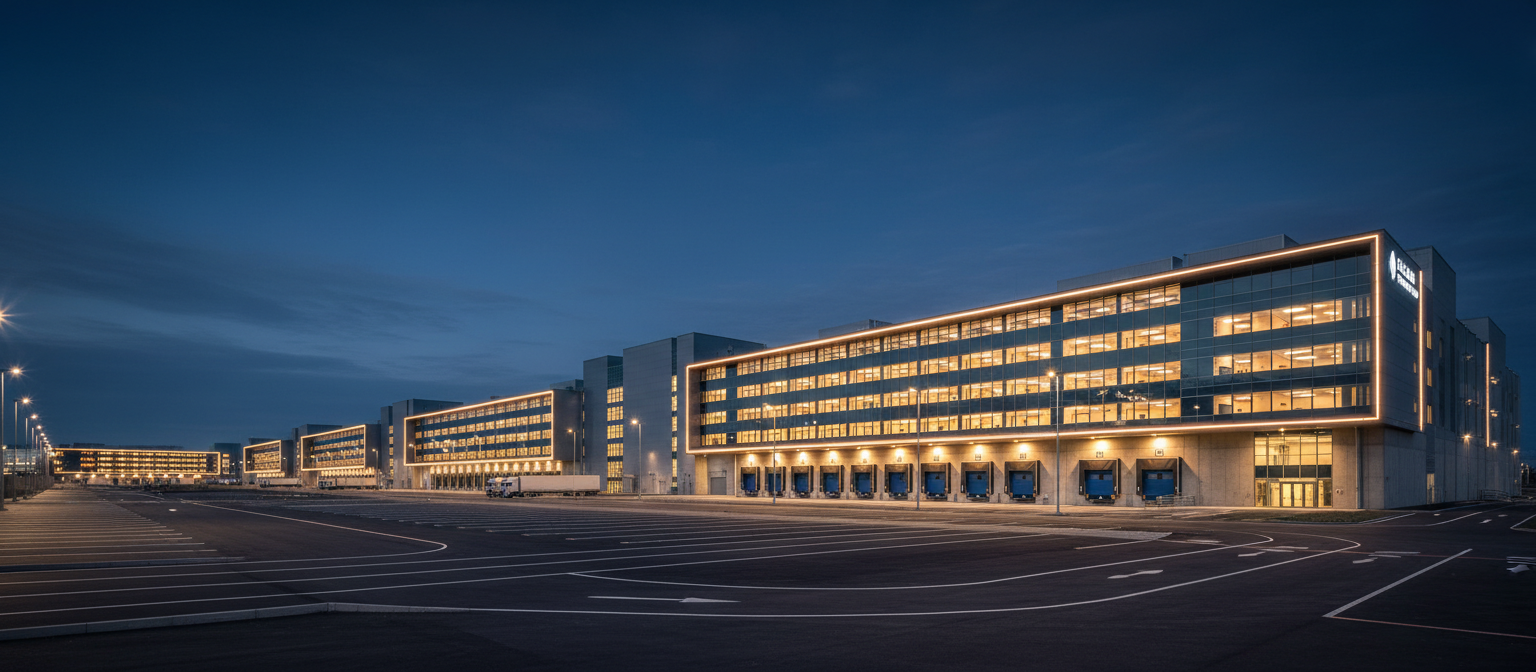
Biotech Lab Humidity Compliance Across 14 Labs
A Kendall Square research campus was logging humidity excursions that threatened study integrity and triggered environmental monitoring deviations. A ten-week psychrometric diagnosis and control remediation took excursions from 23 per quarter to zero, eliminated HVAC-attributable deviations for twelve months, and cut humidification energy 41 percent.
Life-sciences research campus (name withheld at client request)
3 buildings · 240,000 sq ft · 14 laboratories · cleanroom-adjacent suites
Kendall Square, Cambridge, MA
HVAC humidity control, environmental monitoring support, and lab-safe cleaning
Humidity Was Drifting Outside a Tight Lab Spec
Fourteen laboratories were held to a 40–60 percent relative humidity band with tighter tolerances in two cleanroom-adjacent suites. The campus was logging an average of 23 excursions per quarter, each one generating an environmental monitoring deviation and a review that consumed research and quality time.
The building automation system reported that space conditions were satisfied, which made the problem harder to attack: the controls believed they were holding spec while independent monitoring said otherwise. Nobody could say whether the root cause was equipment, sequence, or sensor drift.
- 23 humidity excursions per quarter, each triggering a formal deviation review
- BAS readings and independent monitoring disagreeing on space conditions
- Research scheduling affected by rework and additional verification runs
- Cleaning protocols that had never been validated for lab-adjacent spaces
How the Program Was Built
We logged space and supply conditions across all three buildings for two weeks, alongside valve positions, reheat operation, and humidifier output, to find where the control sequence and the physical system diverged.
Seven humidity sensors were found reading outside tolerance and recalibrated or replaced. Reheat valves were re-characterized, and two stuck valves on the worst-affected air handlers were repaired.
The humidification and reheat sequence was rewritten for staged control with tighter deadbands, eliminating the oscillation that produced short excursions at the band edges.
Cooling coils, drain pans, and duct distribution were cleaned and balanced so supply air could carry the load the sequence asked of it.
Threshold alarms were set with a documented escalation path to on-call technicians, so any drift is caught and logged before it becomes a deviation. Lab-safe cleaning protocols were validated in parallel.
Zero Excursions and a Clean Monitoring Record
Excursions fell from 23 per quarter to zero, and the campus has now gone two consecutive quarters without a single HVAC-driven out-of-band event. Over twelve months, no environmental monitoring deviation has been attributed to HVAC performance.
The controls work also reduced load: staged humidification instead of continuous output cut humidification energy by 41 percent, which showed up on the utility side while the labs ran tighter than they did before.
Independent monitoring data, all 14 laboratories
Against pre-remediation metered consumption
Environmental monitoring review, year one post-remediation
Including two cleanroom-adjacent suites
“We stopped arguing about whether the lab was actually out of spec. The data settled it, the fix held, and our deviation reviews dropped to zero.”
How Fast It Moved
Continuous logging of space conditions, valve positions, and humidifier operation
Sensor verification and valve diagnostics; root-cause findings presented to the client
Sequence rewrite, coil cleaning, balancing, and alarm configuration
Verification logging, protocol sign-off, and handover to ongoing quarterly service
Questions About This Program
Related Service Pages
Want Results Like These?
Tell us your portfolio, your buildings, and the number that hurts. We will scope a program against the same metrics used in this case study — documented, audited, and priced in writing.